US-BFS AmeriFlux

Robert J. Bernard Biological Field Station
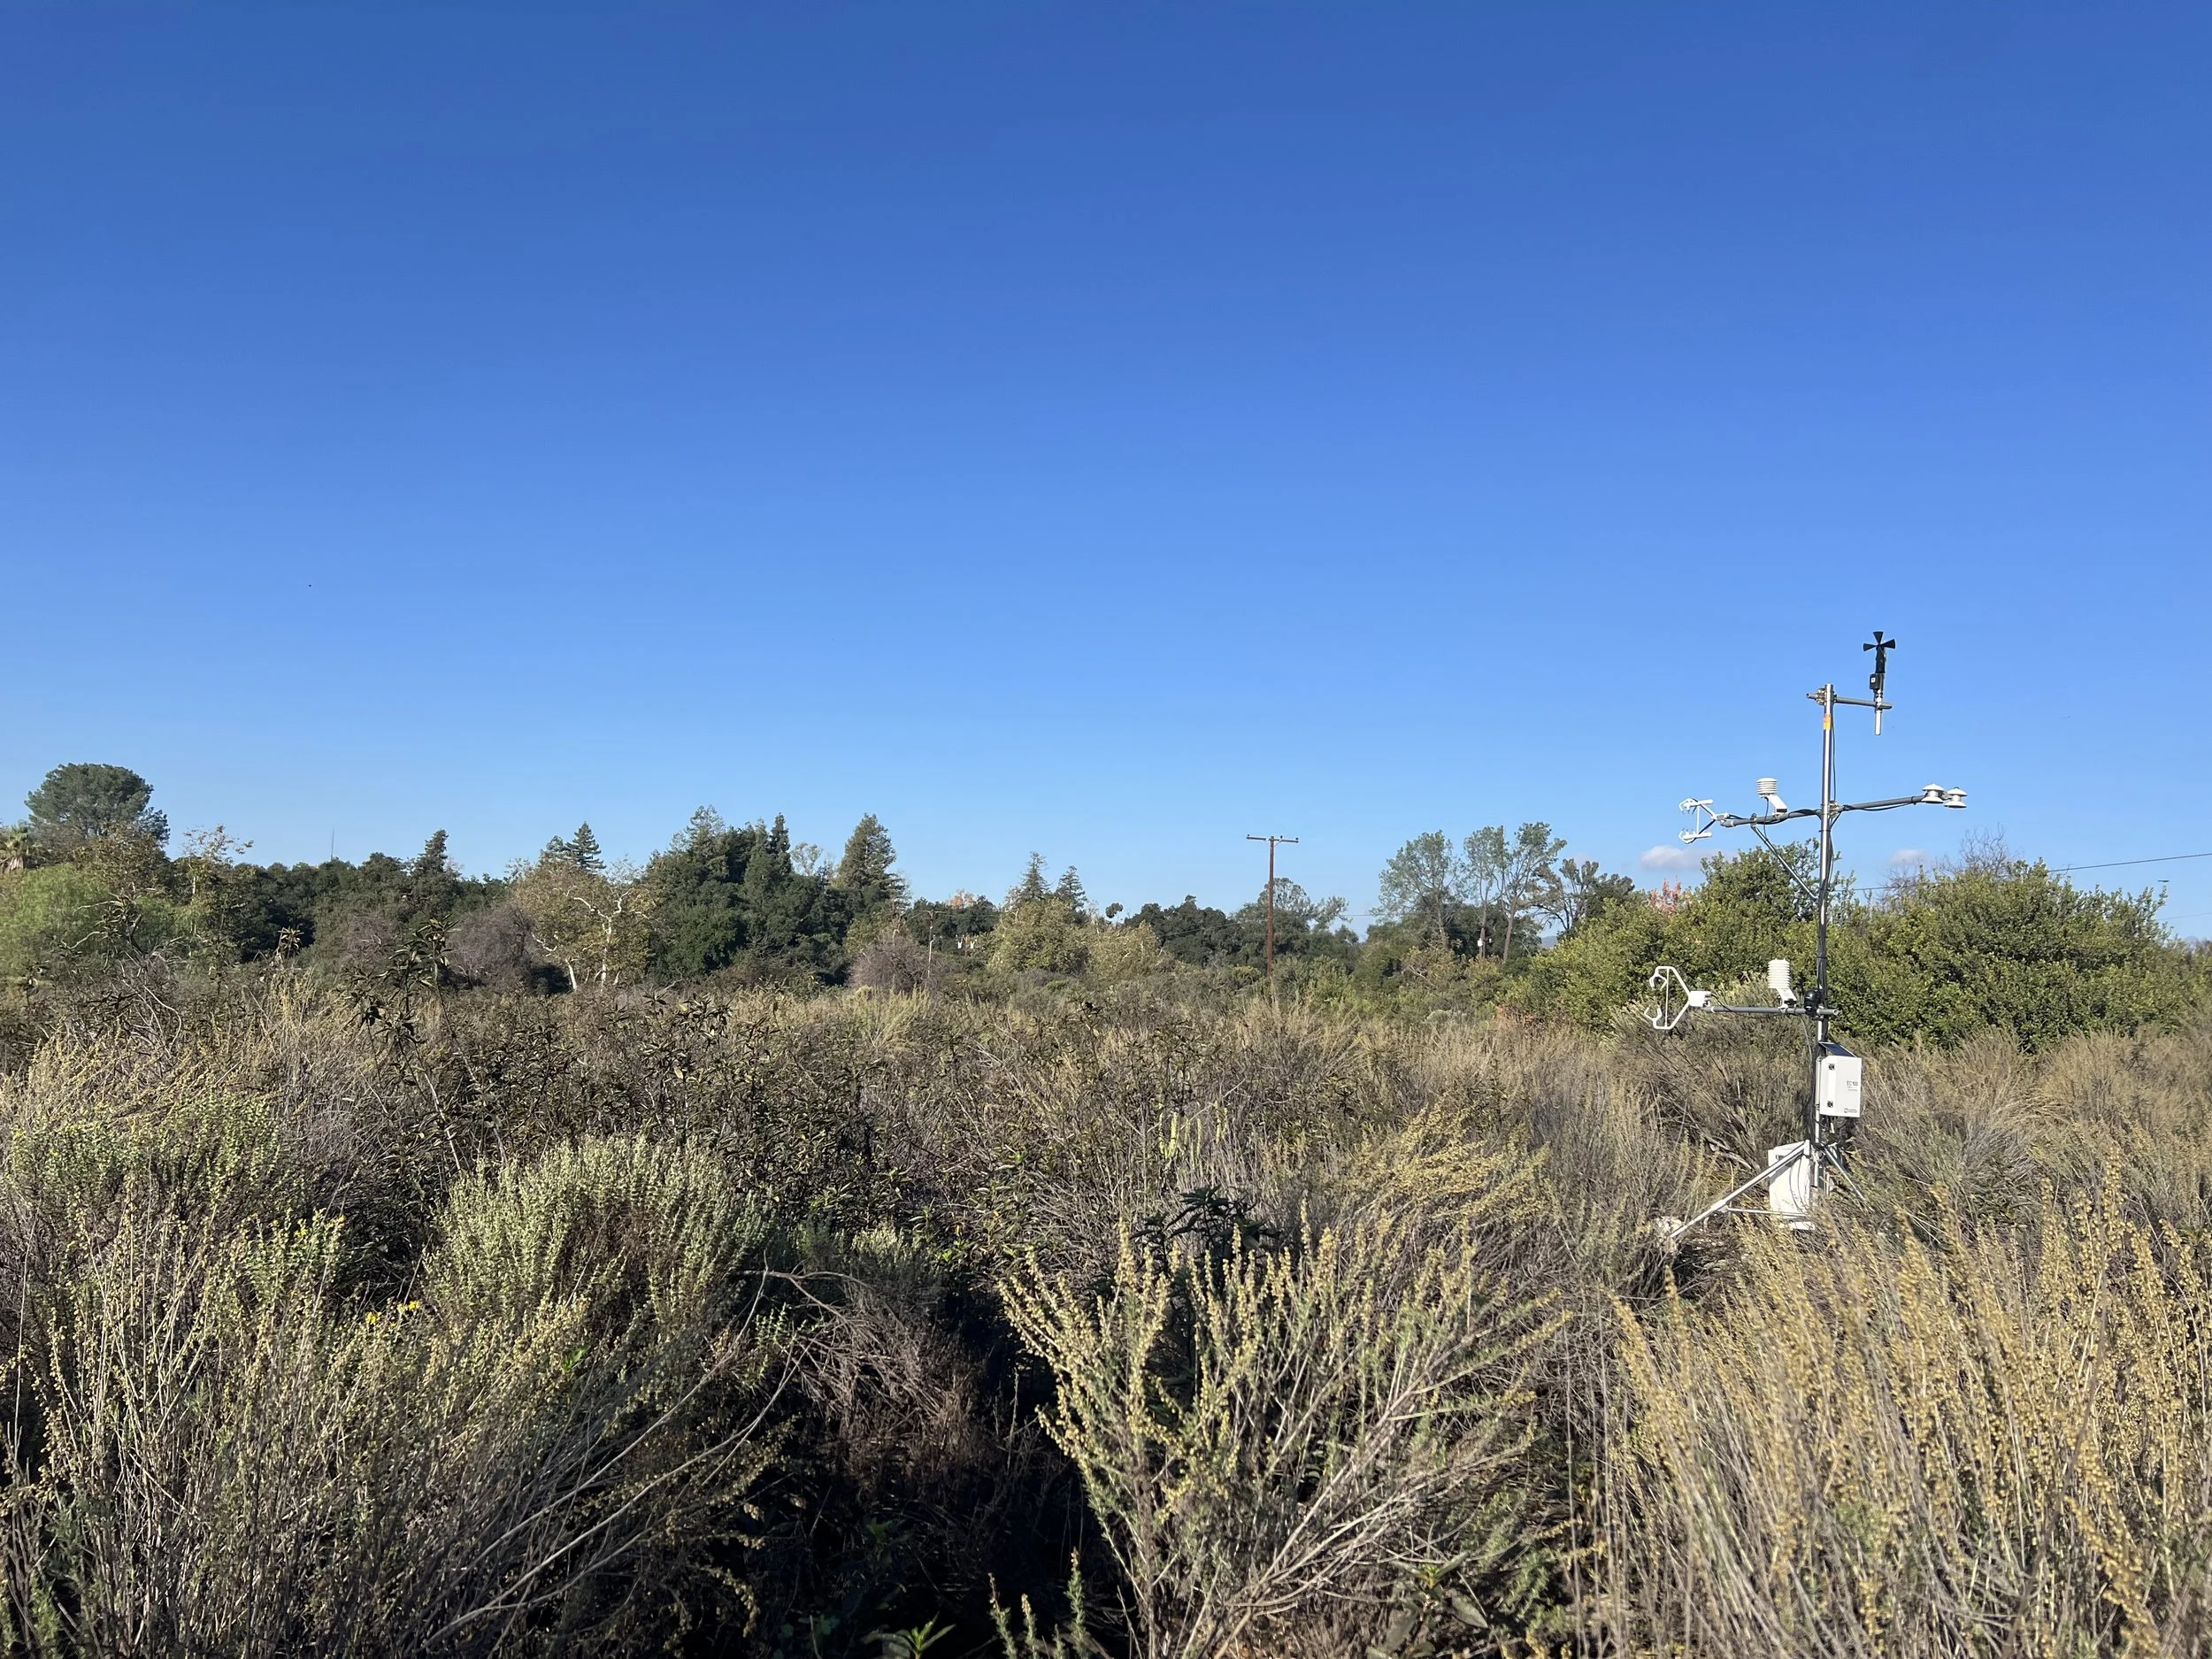
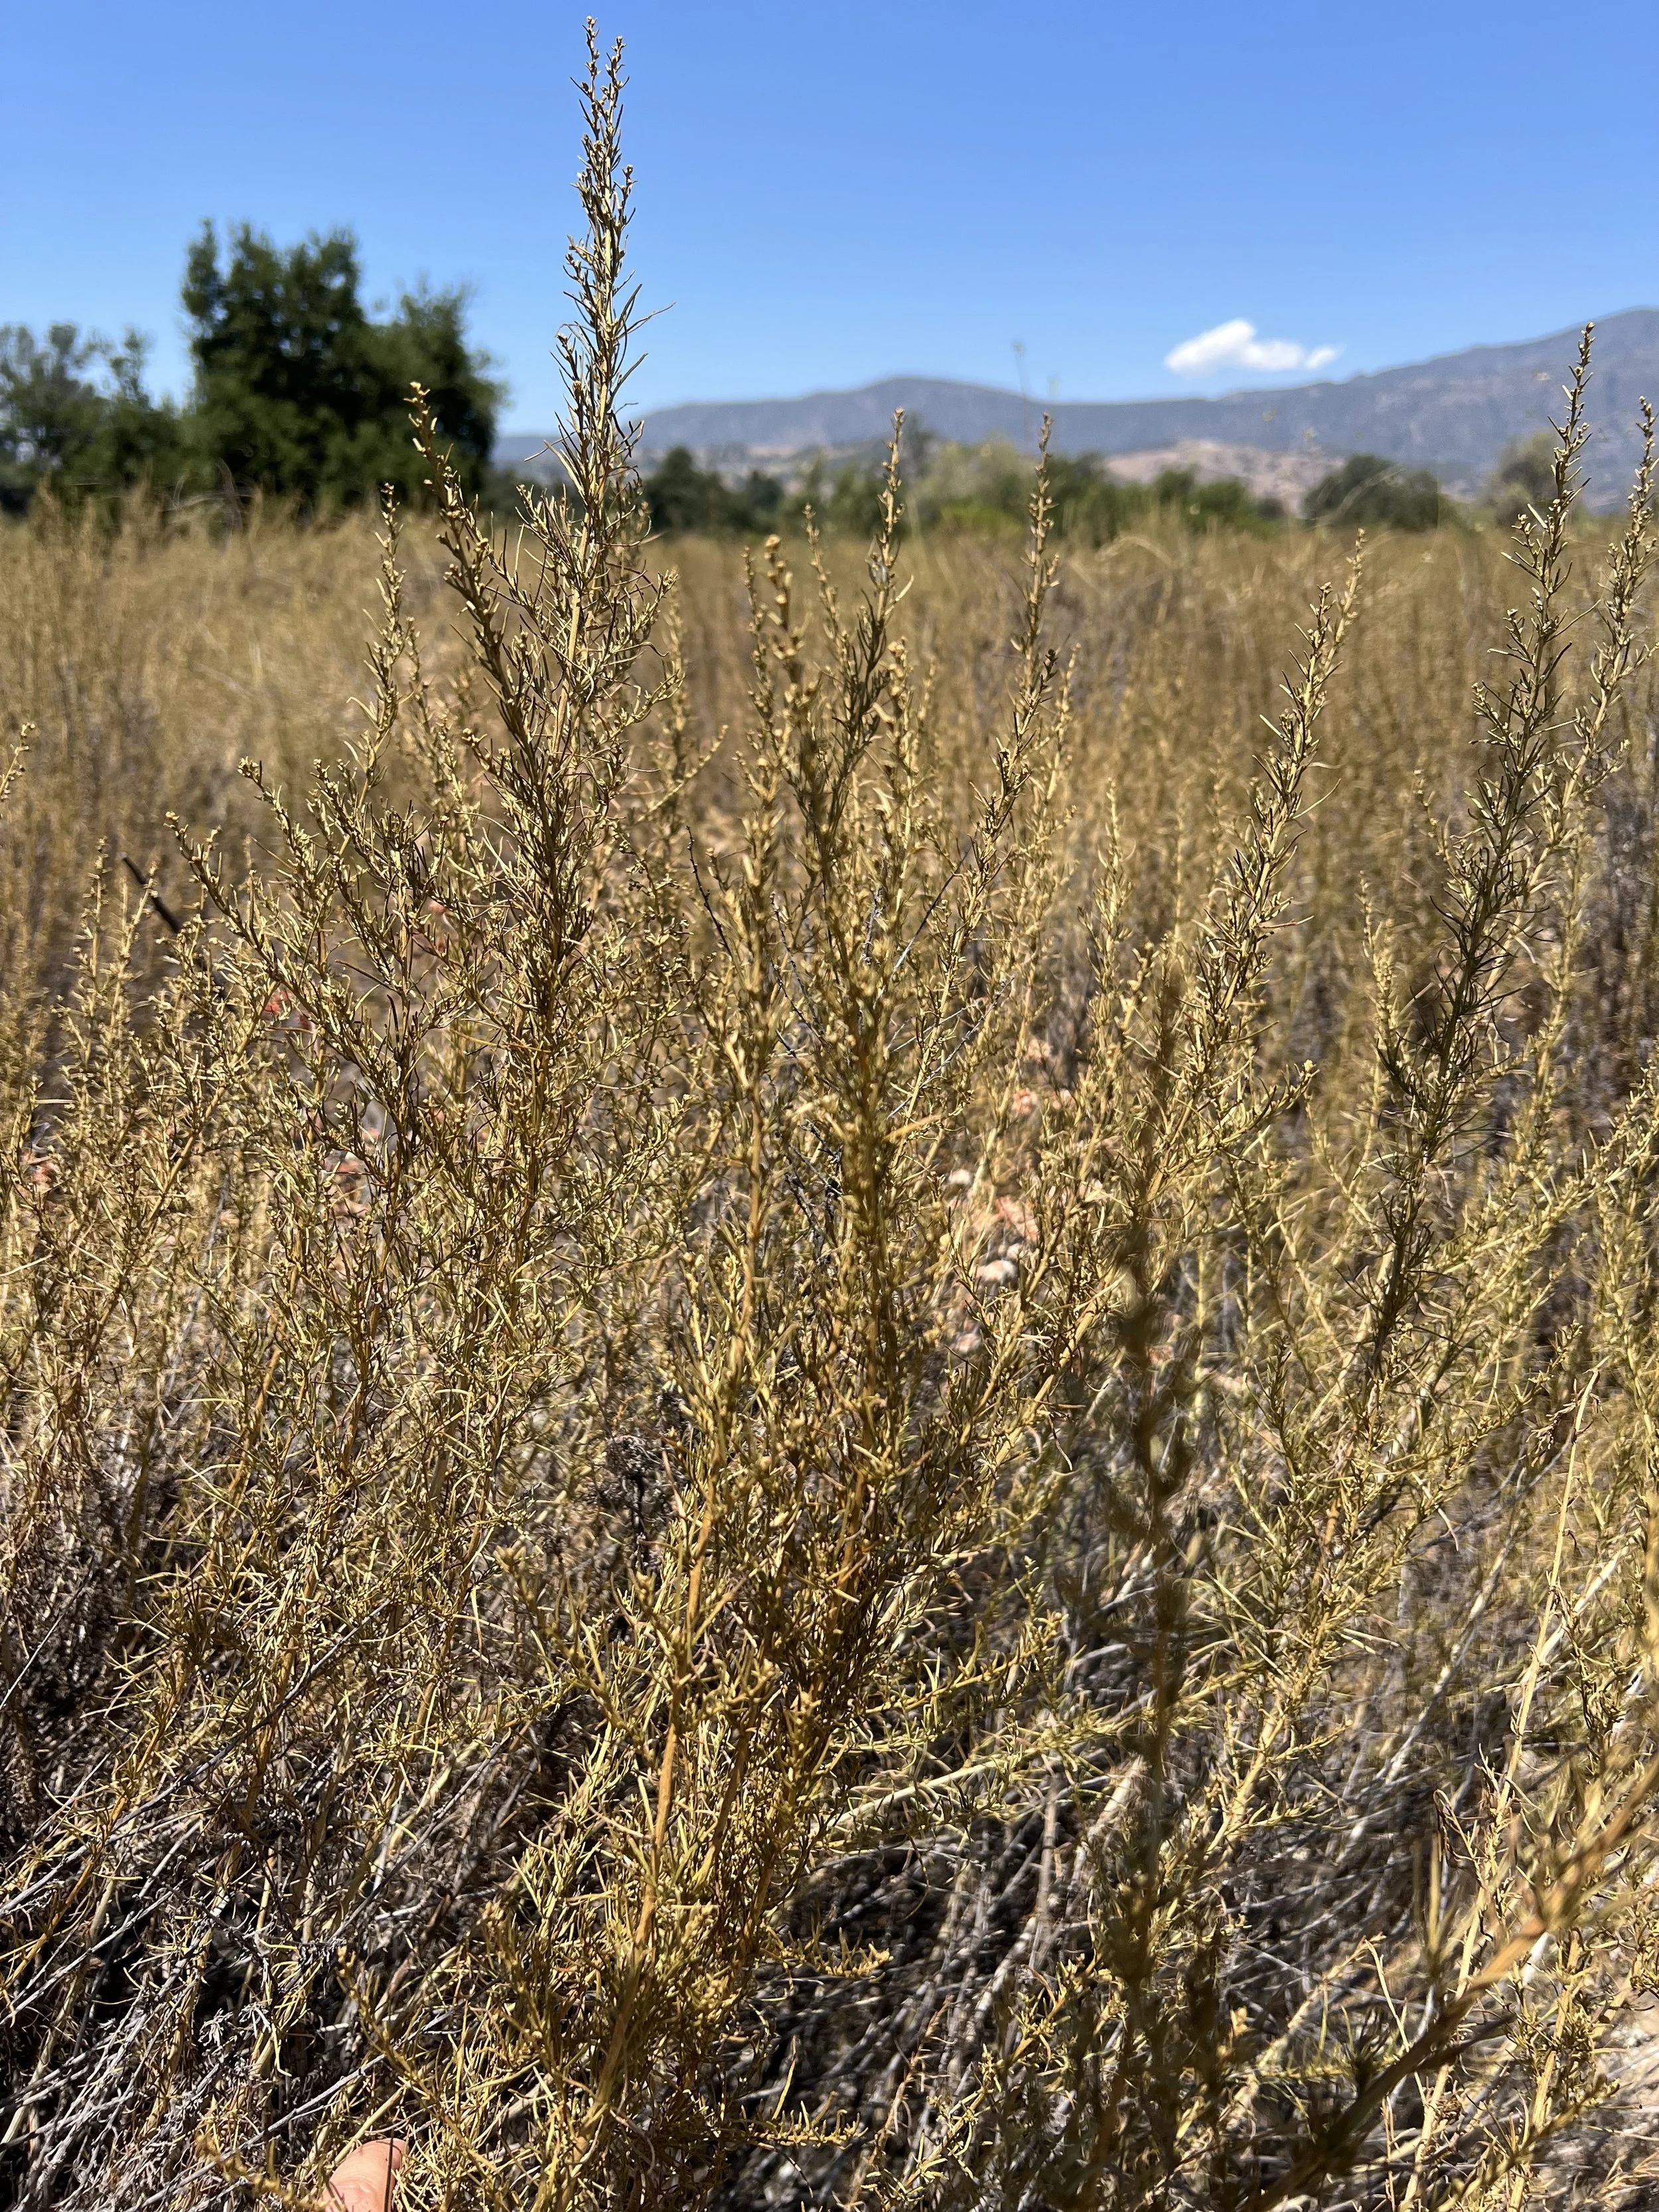
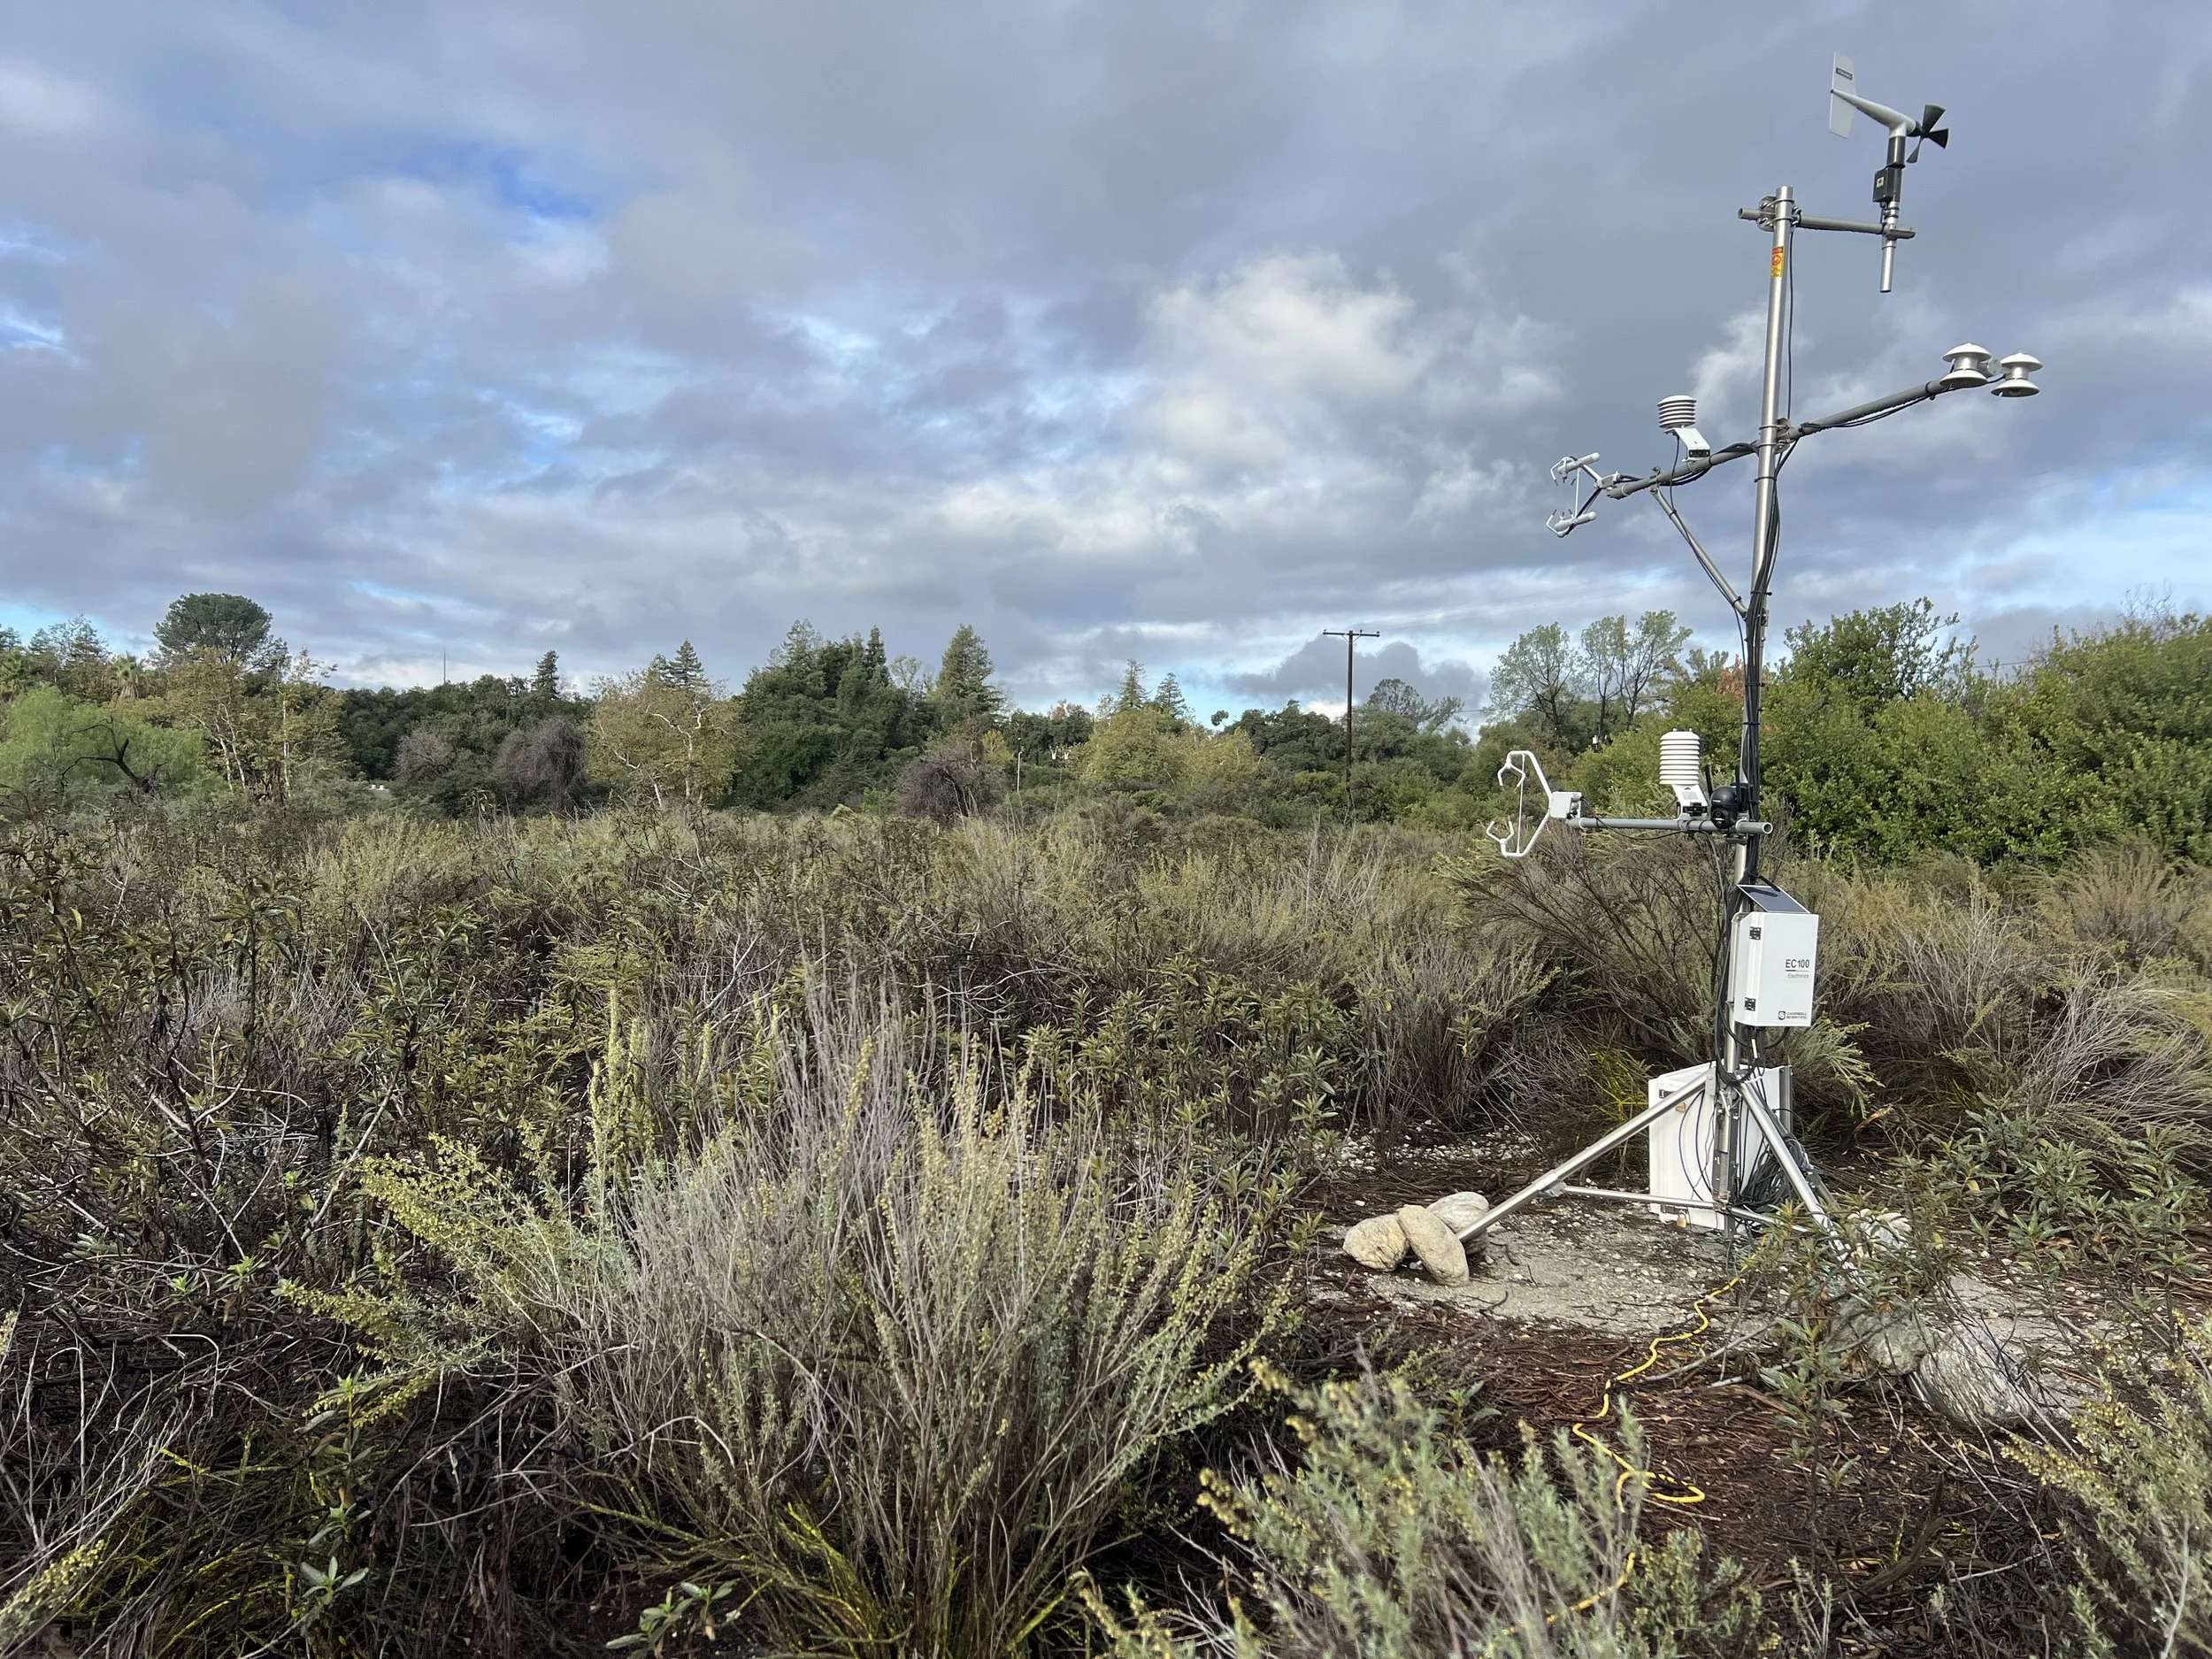
The Bernard Field Station (BFS), an 86-acre academic resource of the Claremont University Consortium, is situated within the campus of The Claremont Colleges in Claremont, CA. Its principal habitats comprise coastal sage scrub, Riversidian alluvial fan scrub, live oak forest, and grassland. Our eddy covariance tower is located in the 'neck' of the field station, home to a protected area of Coastal Sage Scrub, dominated by Artemisia californica. BFS is within walking distance of Harvey Mudd College, serving as an invaluable outdoor laboratory resource for our students. With extensive flora and fauna, including over 170 species of birds, 27 species of mammals, and more than 700 species of insects, BFS embodies a significant ecological haven in a region that is otherwise Southern California suburbs.
The key analytical objectives of the Bernard Field Station site include the measurements of momentum, sensible heat, water vapour, latent heat, and CO₂ exchange between the coastal sage scrub and the atmosphere. Additional research topics include: 1) investigation of the relationships of energy and matter exchanges between the atmosphere and the coastal sage scrub as the region warms and precipitation patterns change; 2) speciated Volatile Organic Compound (VOC) measurements performed directly from plant species that makeup sage scrub community to link reactive carbon fluxes with ecosystem respiration and health; 3) exploring the role of sage scrub emissions on ozone chemistry. 4) plant physiology, particularly involving the dominant Artemisia californica within the coastal sage scrub; 5) studying the long-term impact of climate change on this unique ecosystem.
Check out HMC’s press release for more details on the project!
Instruments
-
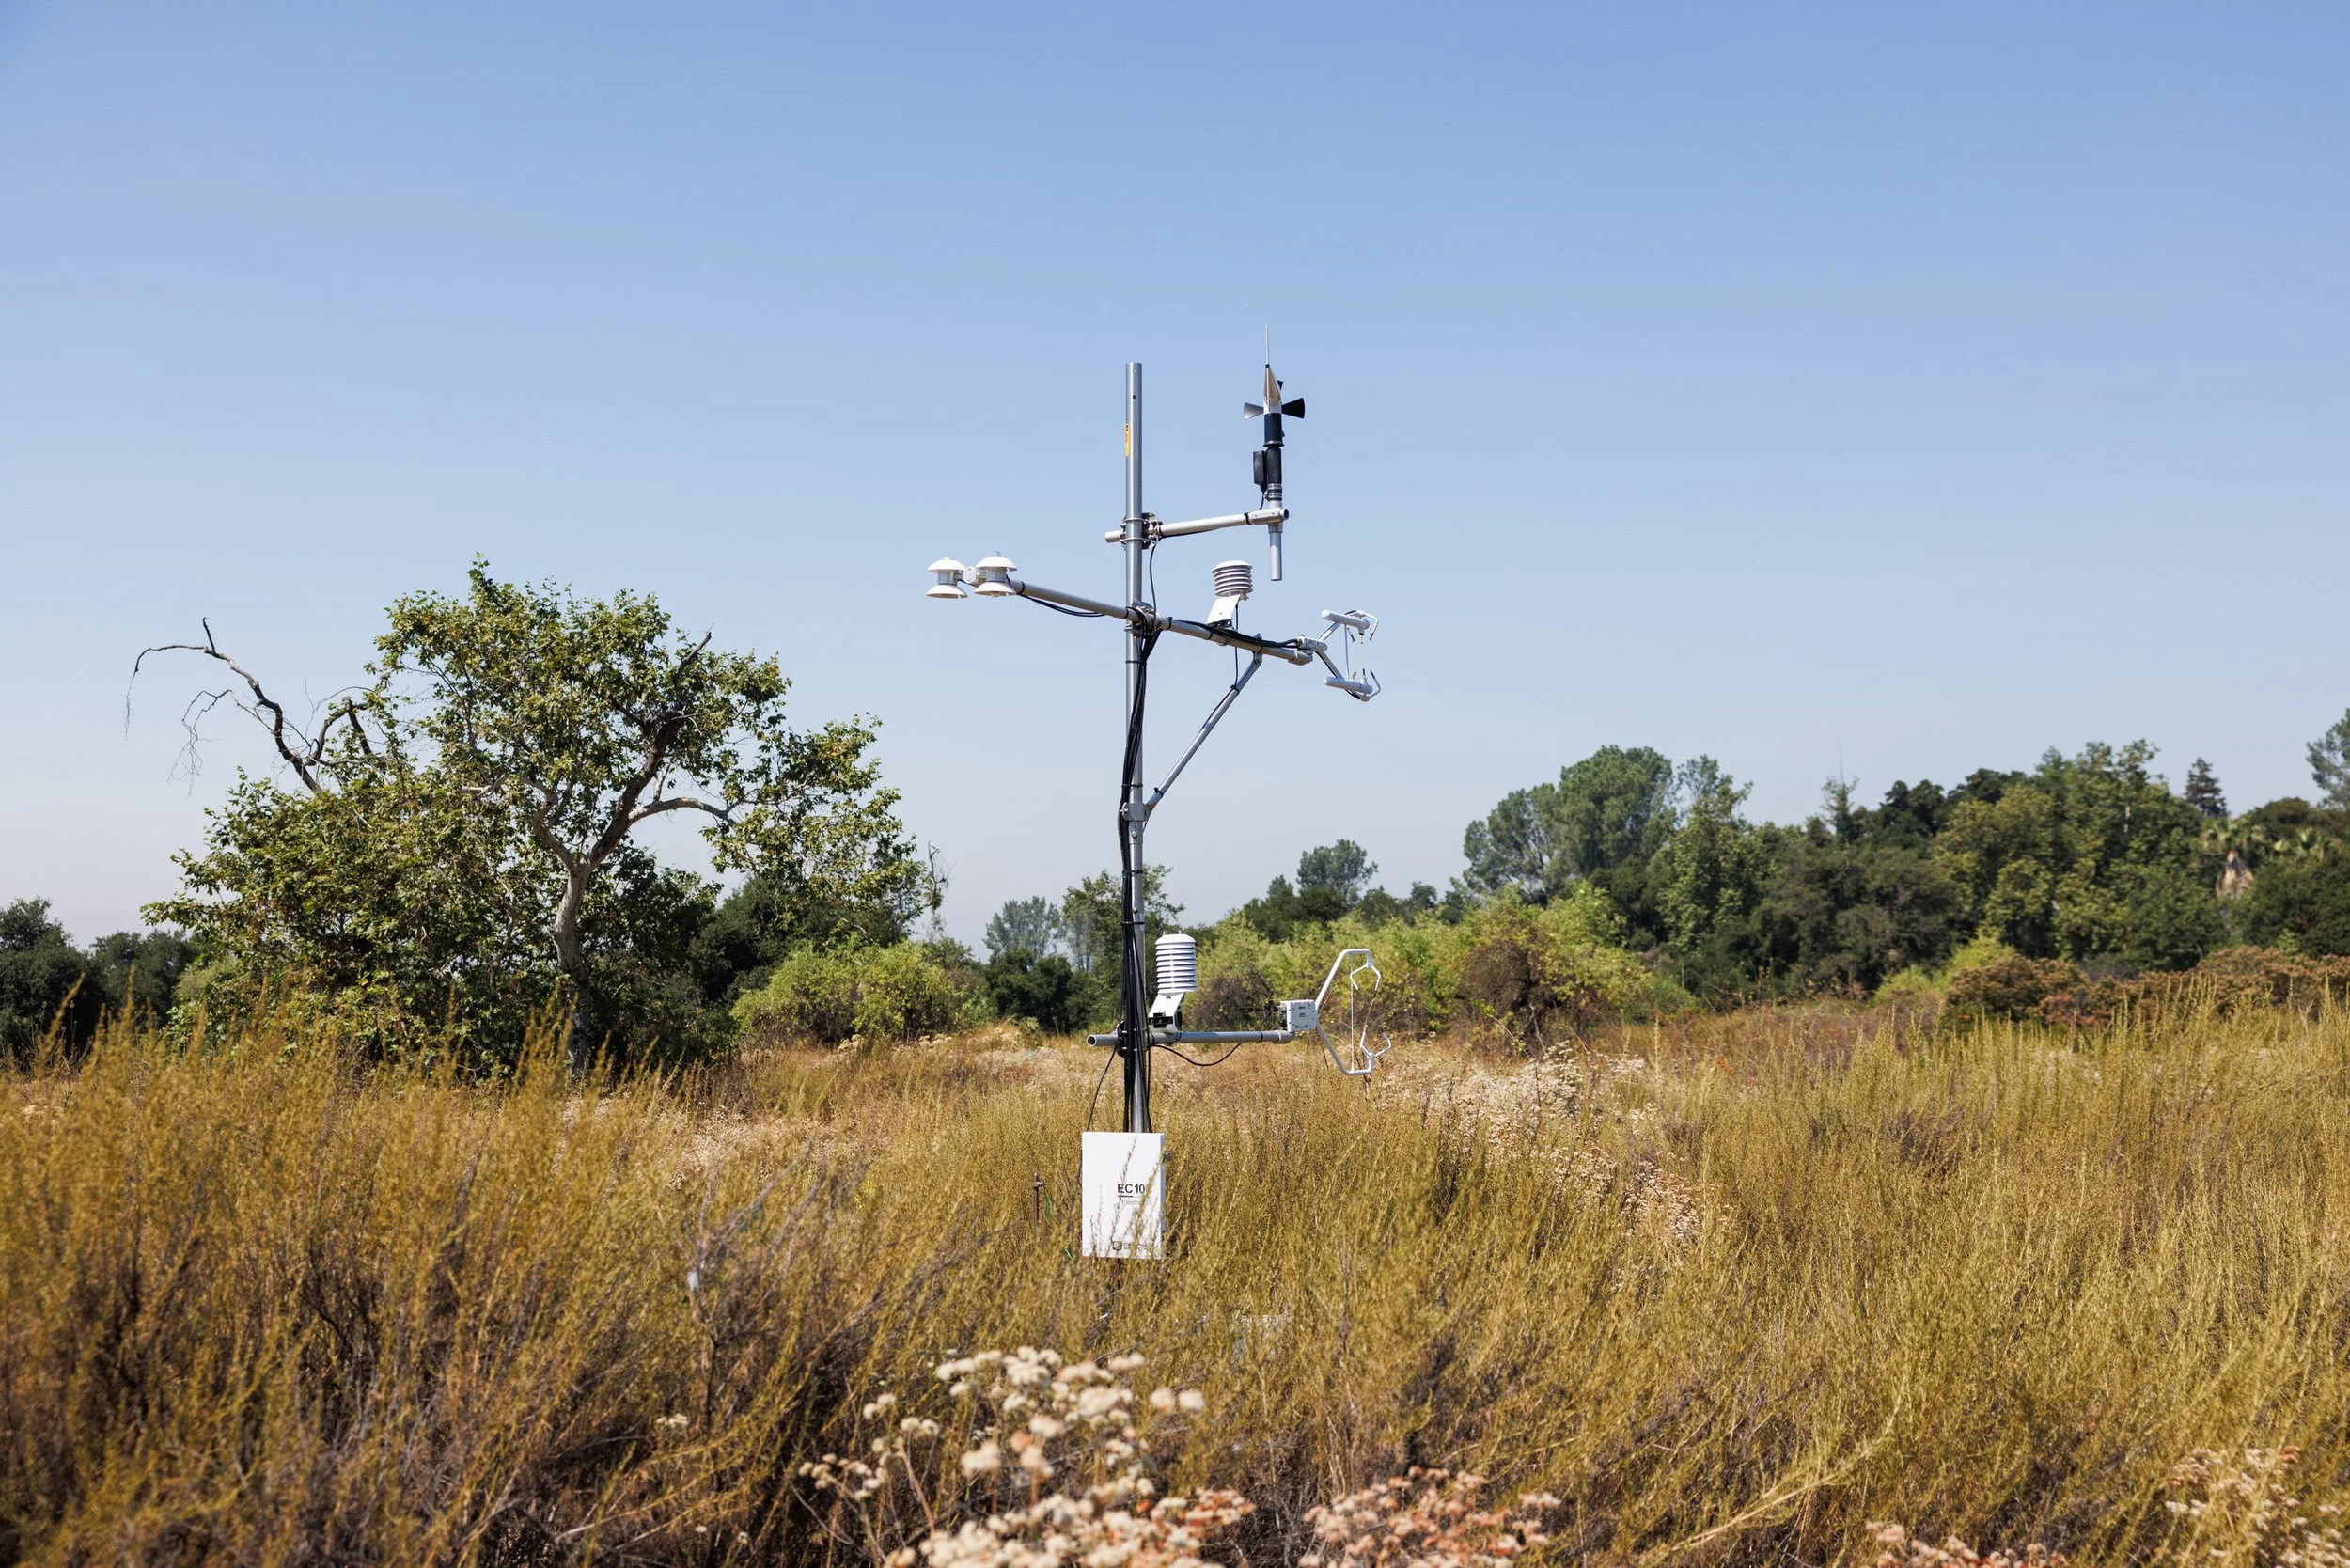
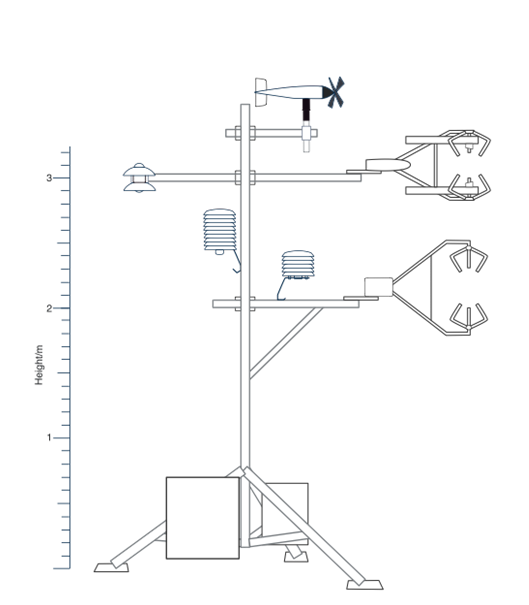
IRGASON (3 m) - CO₂, water vapour, sensible heat, latent heat, and momentum fluxes, 3D wind, friction velocity, stability parameters (Integrated CO₂/H₂O Open-Path Gas Analyzer & 3D Sonic Anemometer)
CSAT3B (1.75 m)- sensible heat and momentum fluxes, 3D wind, friction velocity, stability parameters (Sonic Anemometer)
-
Hukseflux 4-component Net Radiation Sensor (3 m) - long wave in, long wave out, shortwave in, shortwave out, and net radiation
(coming soon) HOBOnet PAR and Solar Radiation (Silicon Pyranometer) Sensors (1.75 m) - PAR (integrated 400 to 700 nm), light intensity (integrated 300 to 1100 nm), and NDVI
Wind Monitor (3.5 m)- wind speed and direction (this is in addition to the data calculated from the sonics)
HygroVue 10Digital Temperature and Relative Humidity Sensor with 10-plate solar radiation shield (3 m) - air temperature and relative humidity
(coming soon) HONOnet Rainfall (metric) Sensor (1.75 m)
(coming soon) HOBOnet Leaf Wetness Sensor
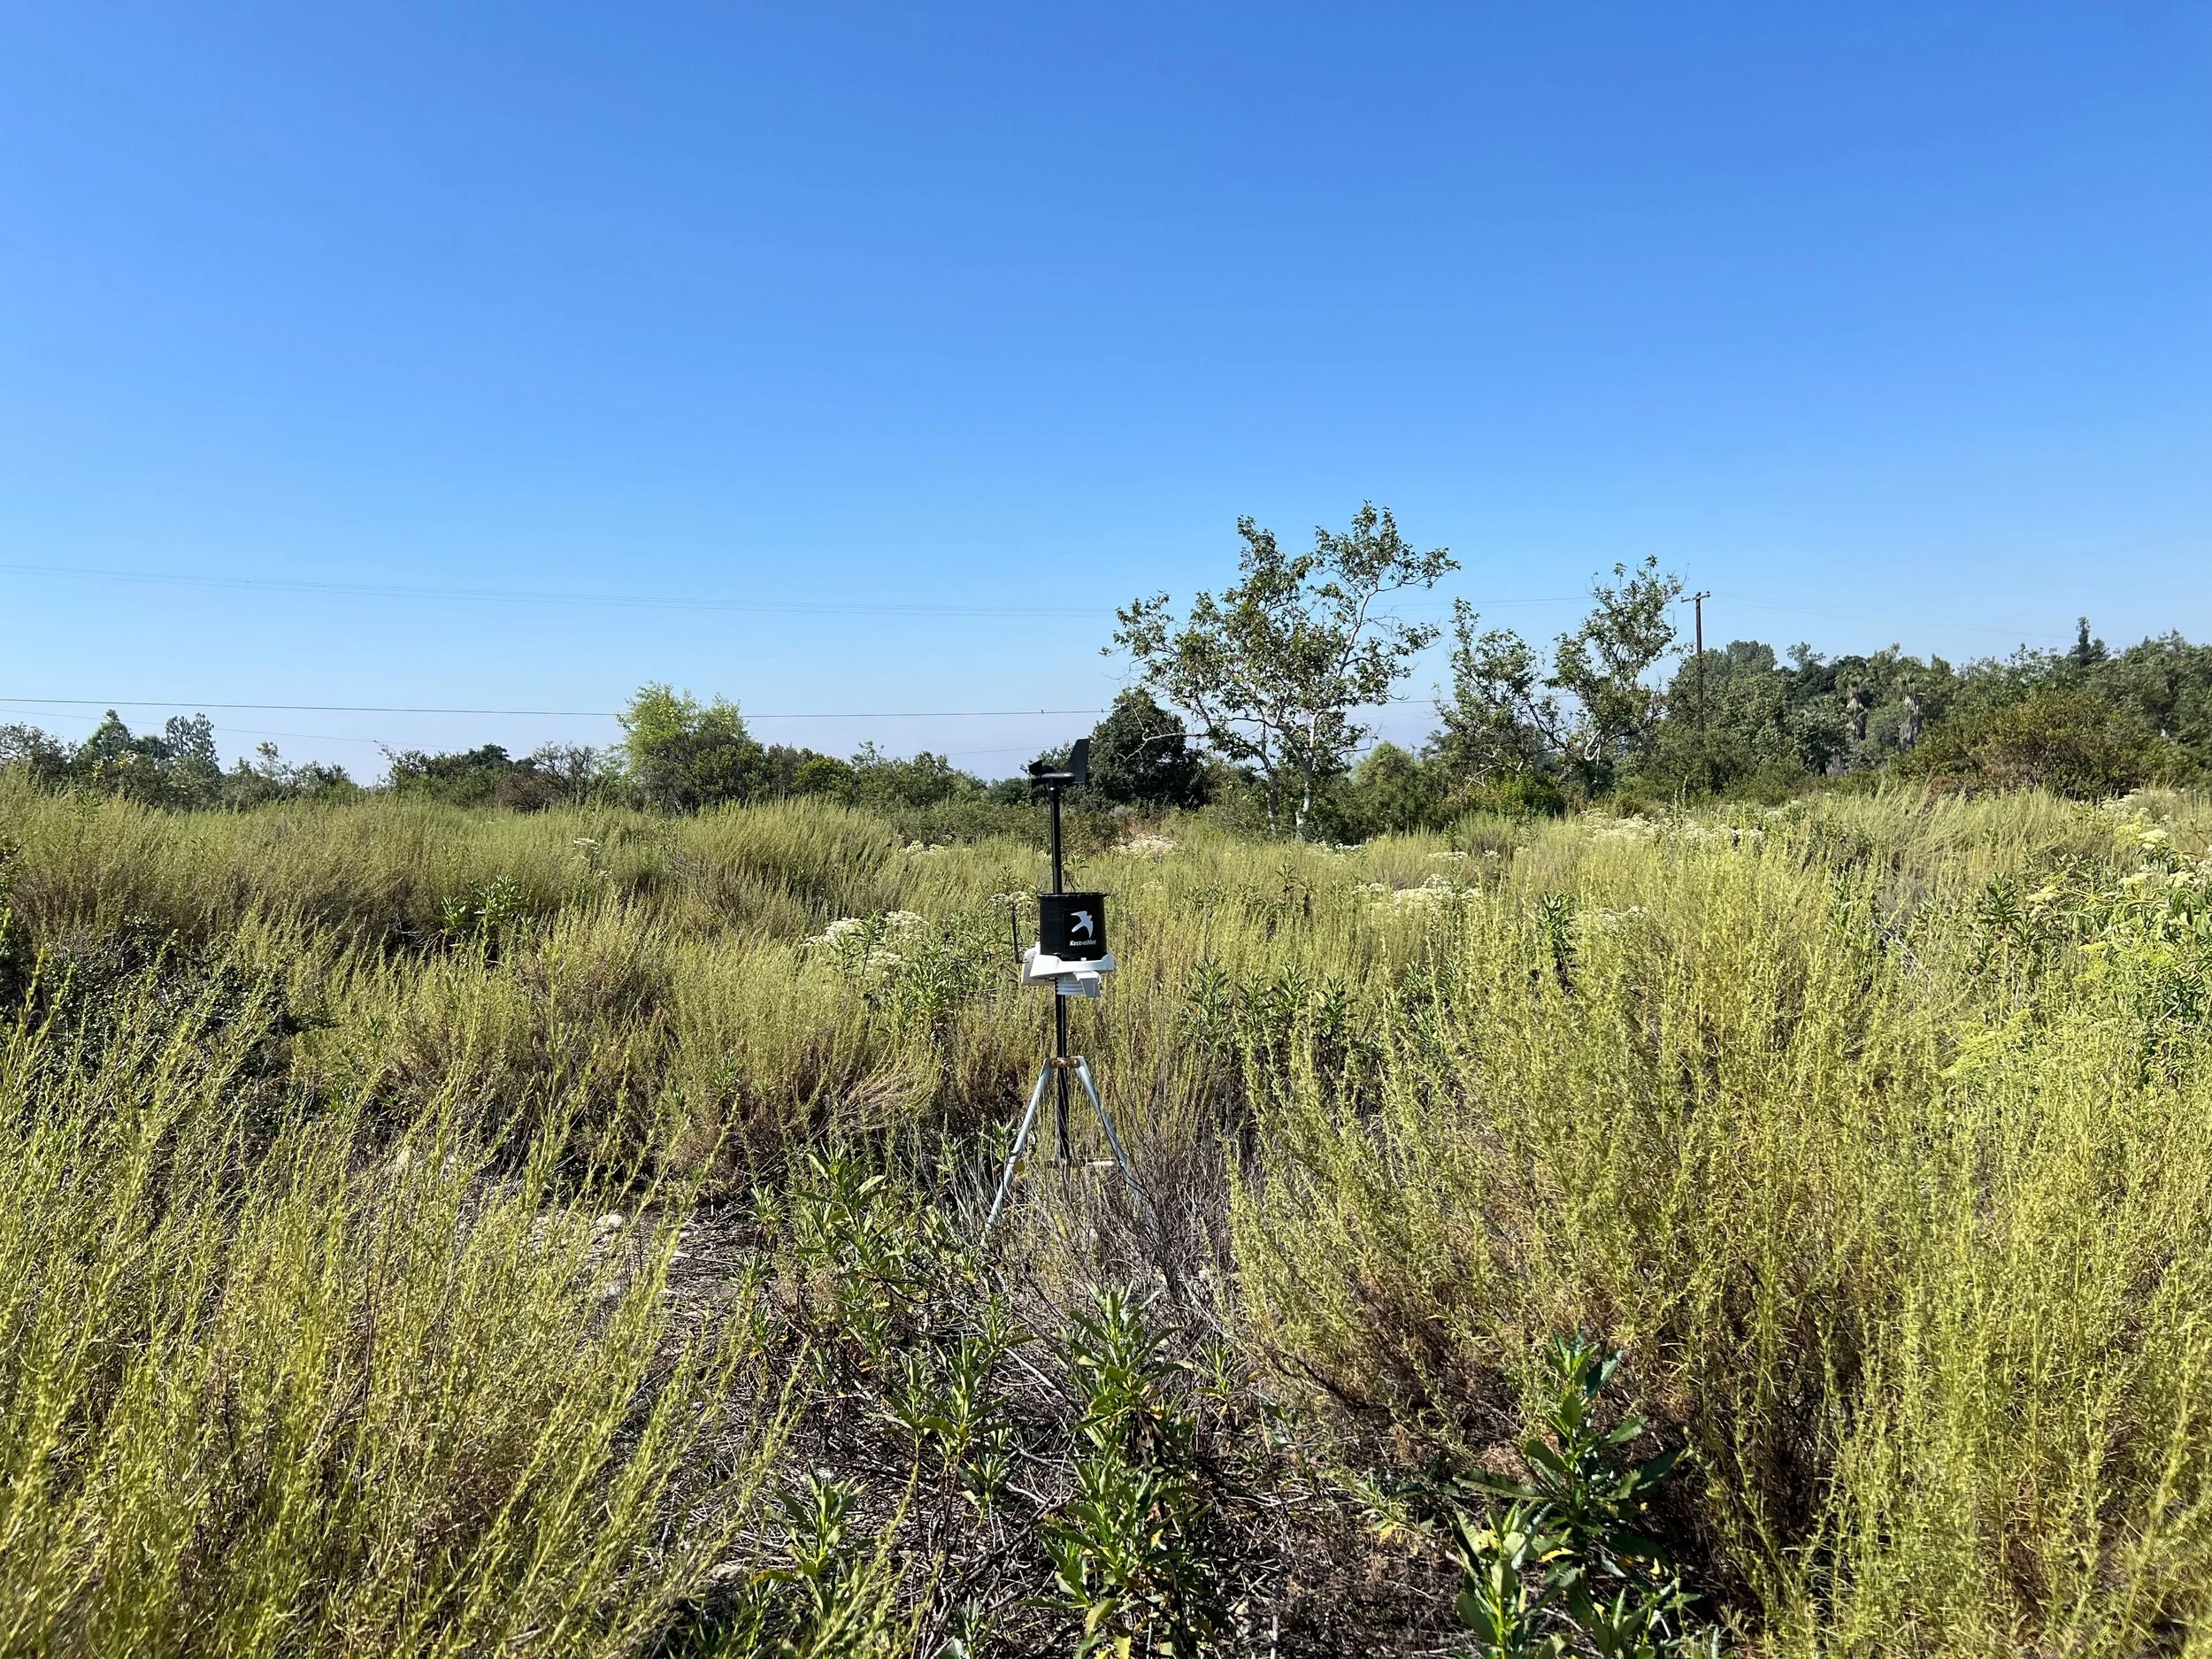
KestrelMet 6000 AG Weather Station with Leaf Wetness & Solar Irradiance Sensor (1.75 m) - wind speed, direction, temperature, relative humidity, pressure, rain, leaf wetness.
KM6000 Soil Probes (10 cm, 25 cm, 35cm) - soil temperature and moisture (tension). Look at some example soil temperature/moisture data from our site!
(coming soon) HOBOnet 45 cm Multi-Depth Soil Moisture Sensor (three soil moisture zones, six temperature depths)
-
IRGASON
CO₂ mixing ratio (3 m)
H₂O mixing ratio (3 m)
QuantAQ MODULAIR
PM₁ (1.75 m)
PM₂.₅ (1.75 m)
PM₁₀ (1.75 m)
CO mixing ratio (1.75 m)
NO mixing ratio (1.75 m)
NO₂ mixing ratio (1.75 m)
O₃ mixing ratio (1.75 m)
Data Access
-
You can access the AmeriFlux online. AmeriFlux BASE: https://doi.org/10.17190/AMF/3004319
More data from the tower can be shared by request.
-
Our KestrelMet 6000 provides real time (every 15 minutes) weather for the site to the Ambient Weather Netowrk.
-
External Links
-
-
-
The BFS maintains a plant species list here: https://bfs.sites.pomona.edu/biota/bfs-plants/
Annual Mean Meteorology
-
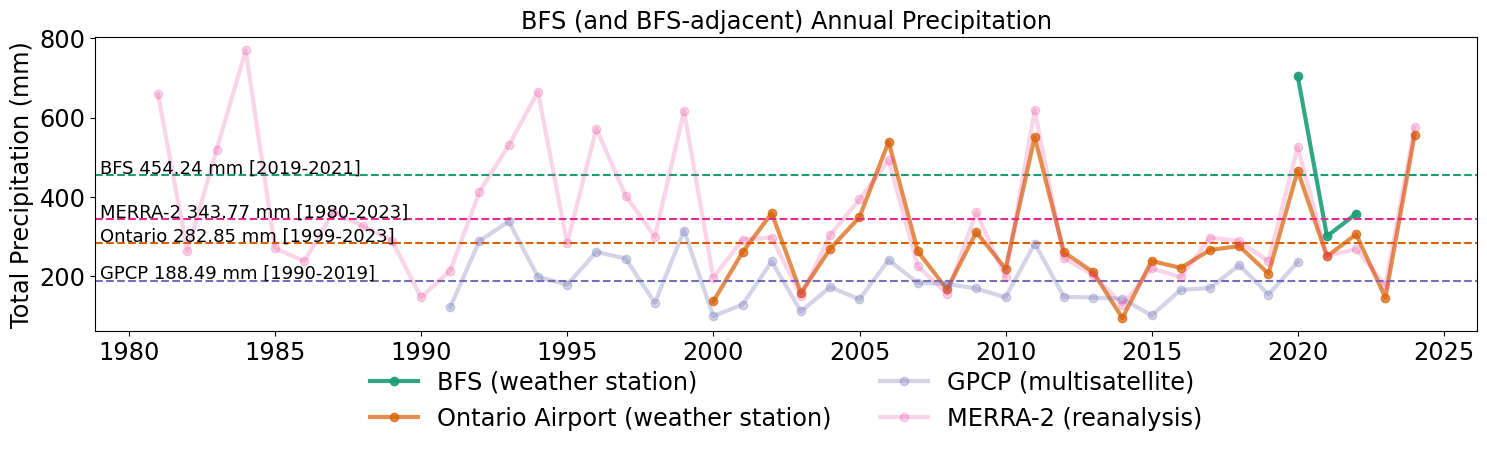
Precipitation
For site characterization, AmeriFlux requires a long-term annual precipitation average. This average needs to be from at least 30 years of data. Meteorological measurements in Claremont have been somewhat intermittent. Given the strong precipitation seasonality (rainy winters, dry summers), significant data gaps make creating such a value from local measurements impossible. The Ontario Airport (roughly 15km away and at a similar elevation of ~288 m vs our 410 m) does provide us with long-term precipitation measurements, however. These observations agree with the MERRA-2 bias-corrected precipitation product (0.5 ° x 0.625 °, one month temporal) but not the GPCP multi-satellite product (0.5 ° x 0.5 ° spatial, one month temporal). While imperfect, we use MERRA-2 to construct our long-term mean because it is consistent with the closest long-term precipitation measurement site (both BFS and the Ontario airport are within the same MERRA-2 pixel) and the limited BFS-specific data we have.
-
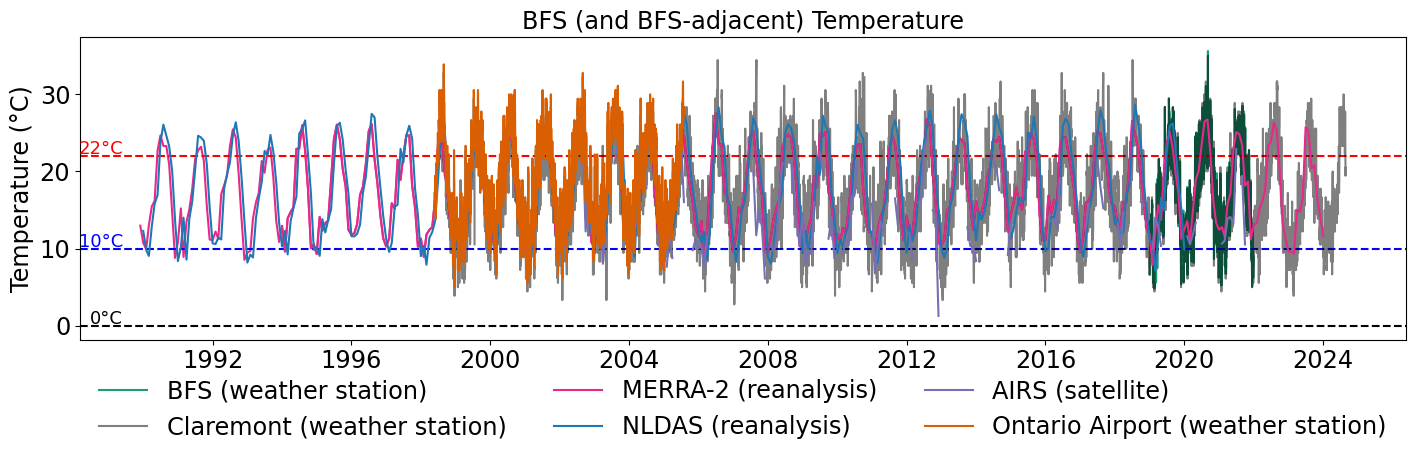
Temperature
The differing data sources for temperature products showed much more agreement, with annual average temperatures around 17-18 °C from local weather stations, reanalysis products, and the AIRS satellite.
The historical local weather station data was found through NOAA's 'Past Weather' portal.
Combined, the temperature and precipitation data also let us confirm that our site is considered Hot-summer Mediterranean under the Köppen climate classification: "coldest month averaging above 0 °C, at least one month's average temperature above 22 °C, and at least four months averaging above 10 °C. At least three times as much precipitation in the wettest month of winter as in the driest month of summer, and the driest month of summer receives less than 40 mm".
Site Selection and Tower History


-
The placement of this tower and instrumental design are thanks to Helen Chen, who created our AmeriFlux site for her undergraduate thesis (Preparatory Work for Long-term Greenhouse Gas Flux Measurements at the Robert J. Bernard Field Station, Claremont, California, Harvey Mudd College, Department of Chemistry, 2023-2024).
The site location and measurement heights were chosen based on looking at available wind data from the BFS so that the fetch (the area our fluxes represent) would be in the region of native sage scrub at the field station. Sorin Jayaweera and Helen set up and tested the instruments in the lab to make sure things were ready to go.
-
The FICUS Lab summer 2024 crew (Helen Chen, Mia Mirabelli, Anna Figge, and Matthew Simpson) took everything to the field, built the tower, and got things running!
-
Matthew Simpson wrote the group's code (from scratch!) to process raw data into high quality flux data. Check out this nearly 2-week time series (the first data we processed) to see an example of what our tower tells us.
-
In January 2025, just as the rainy season was getting underway, our solar generator was stolen and the tower needed to go dark for awhile to replan.
-
With all of our components replaced, the Summer 2025 FICUS team moved the tower to a slightly better location within BFS and set-up a new solar generator. Matthew Simpson found an ideal site such that we’d have a pristine footprint of coastal sage scrub (predominantly Artemisia californica). Matthew, Stephanie Fulcar, Kennetta Roebuck, Anna Figge, and Tzaara Jauhar moved the tower to the new location (with the help of Prof. Wloka and Prof. Keller) with new measurements beginning in June 2025.

US-BFS in its intended long-term home in the neck of the Bernard Field Station. The flux footprint consists of >60% Artemisia californica.

A time series of CO₂ flux from US-BFS over the summer of 2025. Despite the heat, our ecosystem is still serving as an important carbon sink! Matthew Simpson processed this data with completely custom-written code.
Citation: Sarah Kavassalis (2025), AmeriFlux BASE US-BFS Robert J. Bernard Biological Field Station, Ver. 1-5, AmeriFlux AMP, (Dataset). https://doi.org/10.17190/AMF/3004319
-
In February 2026, we added a new, 2 m, meteorological array to add an explicit PAR measurement to the site.
Friends of the Footprint
BFS is home to diverse wildlife. The tower gets regular visits from some of sage scrub mammals.
Bobcats are regular visitors to US-BFS.
Coyotes are common at BFS but rarely visit our tower.
Desert cotton tails are right at home here.
Contact Us
For questions about the data or instruments, contact:
Sarah Kavassalis
skavassalis[at]g.hmc.edu